Abstract
This article examines German mortality statistics for 2016 through 2020, challenging the conventional interpretation of COVID-19 impact presented by Statistisches Bundesamt. Through analysis of age stratified mortality rates adjusted for demographic shifts, the data reveal a substantially more nuanced picture than aggregate death counts suggest.
Methodology
Statistisches Bundesamt1 announced an ad hoc evaluation of mortality figures for 2020/20212 asserting significant COVID-19 impact3. This analysis challenges that interpretation by examining mortality rates normalized for population size within age cohorts, rather than relying on absolute death counts which conflate demographic changes with pandemic effects.
Death Statistics by Age Group
Aggregate mortality data for Germany 2016 through 2020 demonstrates continuously increasing total deaths, rising from 910'899 in 2016 to 985'535 in 2020. However, this 8.2% increase occurs against a backdrop of significant demographic shifts that must be isolated to assess pandemic specific mortality.
| Age group | 2016 | 2017 | 2018 | 2019 | 2020 |
|---|---|---|---|---|---|
| 0-15 | 3'797 | 3'573 | 3'613 | 3'556 | 3'421 |
| 15-30 | 4'372 | 4'155 | 4'202 | 3'969 | 3'866 |
| 30-35 | 2'690 | 2'713 | 2'637 | 2'635 | 2'679 |
| 35-40 | 3'717 | 3'752 | 3'833 | 3'899 | 4'146 |
| 40-45 | 5'852 | 5'314 | 5'547 | 5'435 | 5'897 |
| 45-50 | 12'792 | 11'752 | 11'060 | 10'140 | 9'784 |
| 50-55 | 23'592 | 22'882 | 22'654 | 21'415 | 20'908 |
| 55-60 | 35'433 | 35'073 | 36'452 | 35'552 | 36'646 |
| 60-65 | 47'458 | 47'691 | 49'584 | 48'966 | 50'941 |
| 65-70 | 60'803 | 62'730 | 65'660 | 65'504 | 67'526 |
| 70-75 | 78'466 | 75'588 | 75'437 | 73'890 | 78'593 |
| 75-80 | 138'767 | 139'232 | 137'300 | 129'065 | 123'131 |
| 80-85 | 155'872 | 165'342 | 176'688 | 181'439 | 194'678 |
| 85+ | 337'288 | 352'466 | 360'207 | 354'055 | 383'319 |
| Total | 910'899 | 932'263 | 954'874 | 939'520 | 985'535 |
Source: Sterbefälle - Fallzahlen nach Tagen, Wochen, Monaten, Altersgruppen, Geschlecht und Bundesländern für Deutschland 2016–2021, Statistisches Bundesamt.
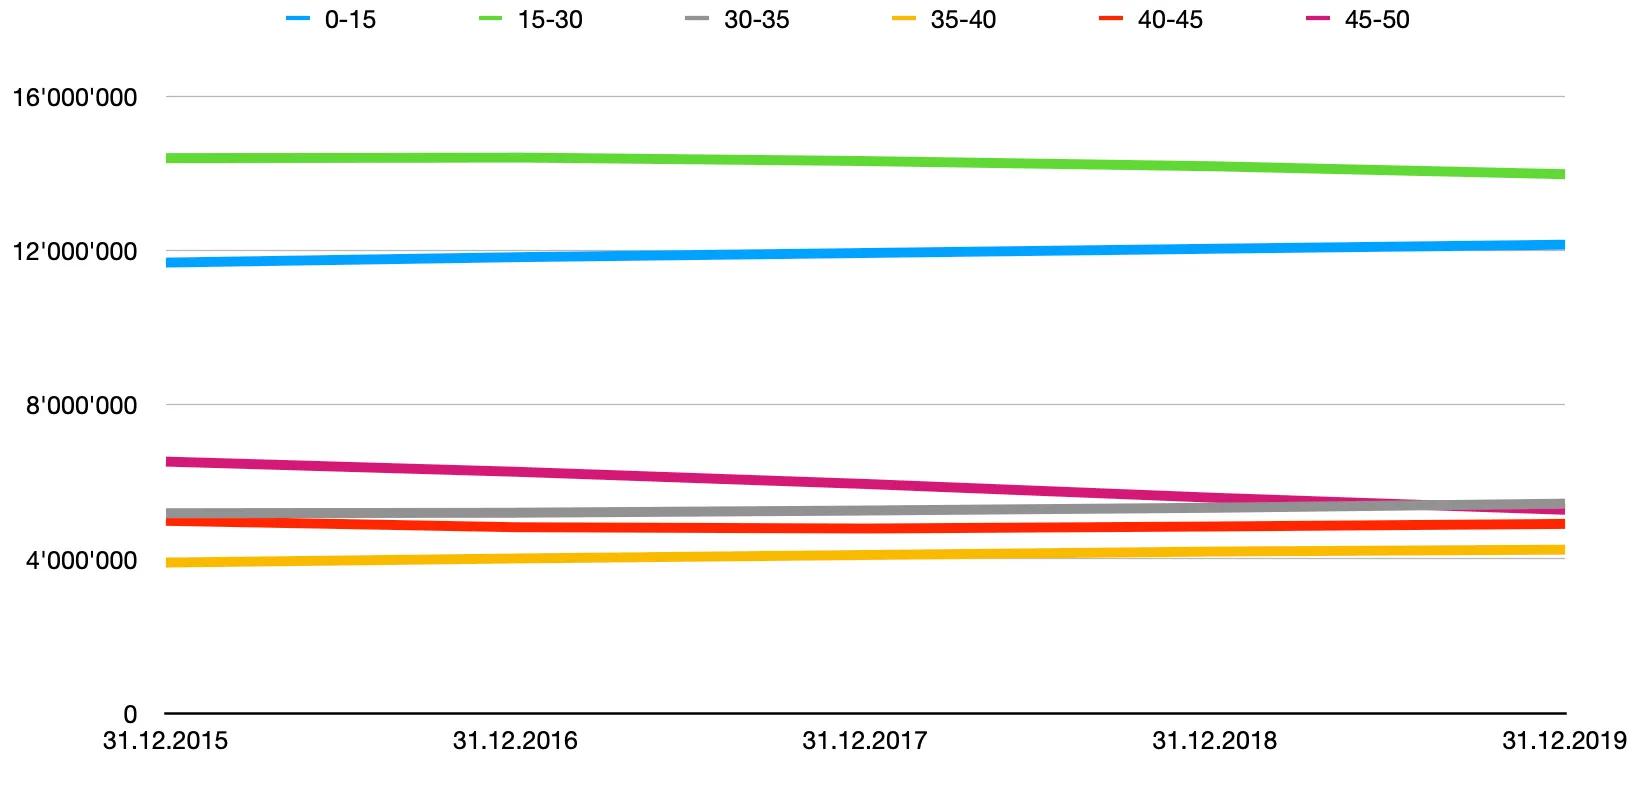
Graphical representation reveals temporal trends within each age cohort more clearly than tabular data alone:
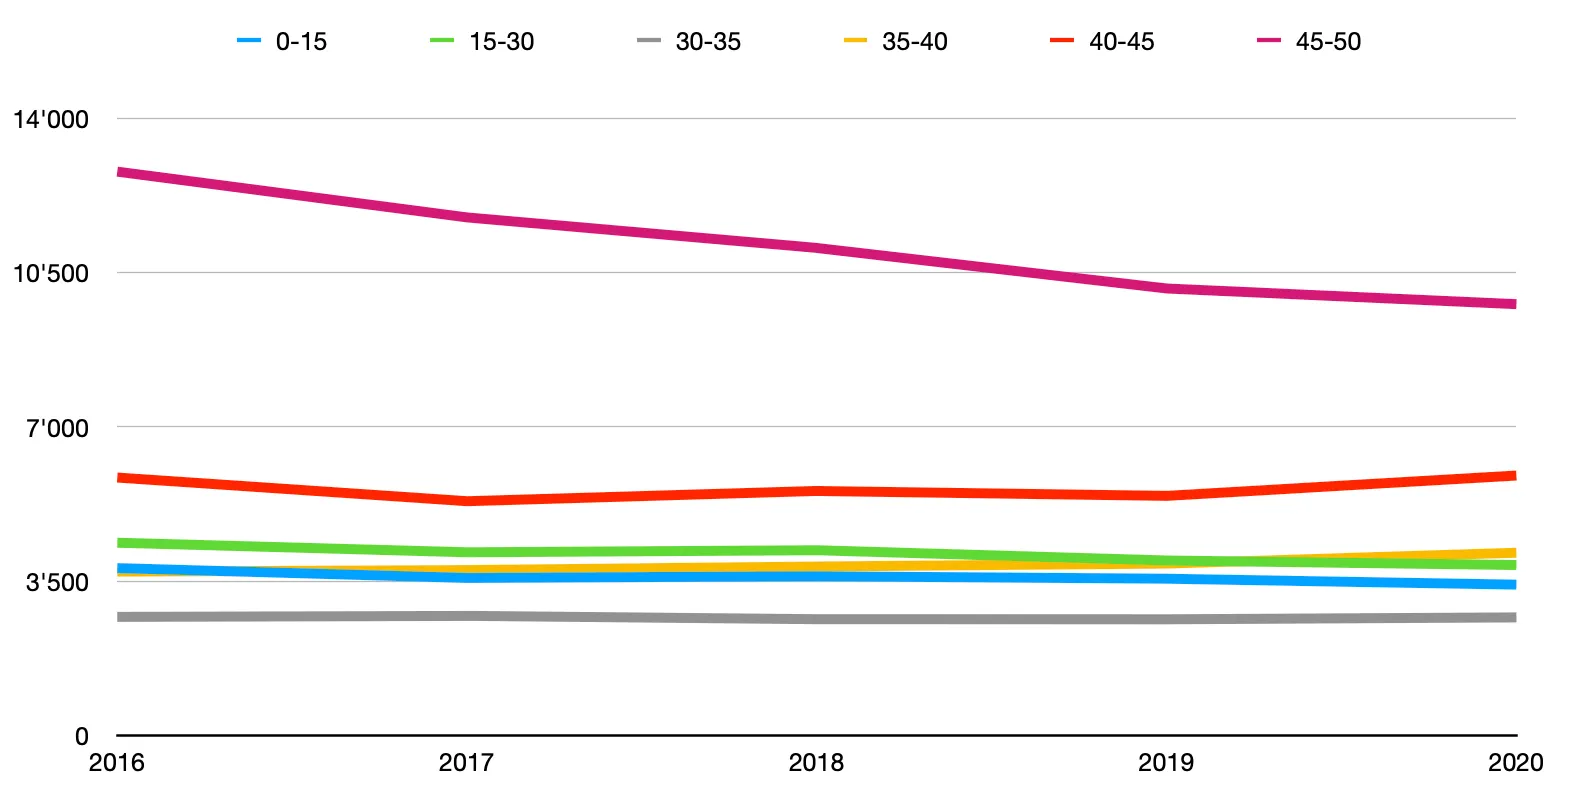
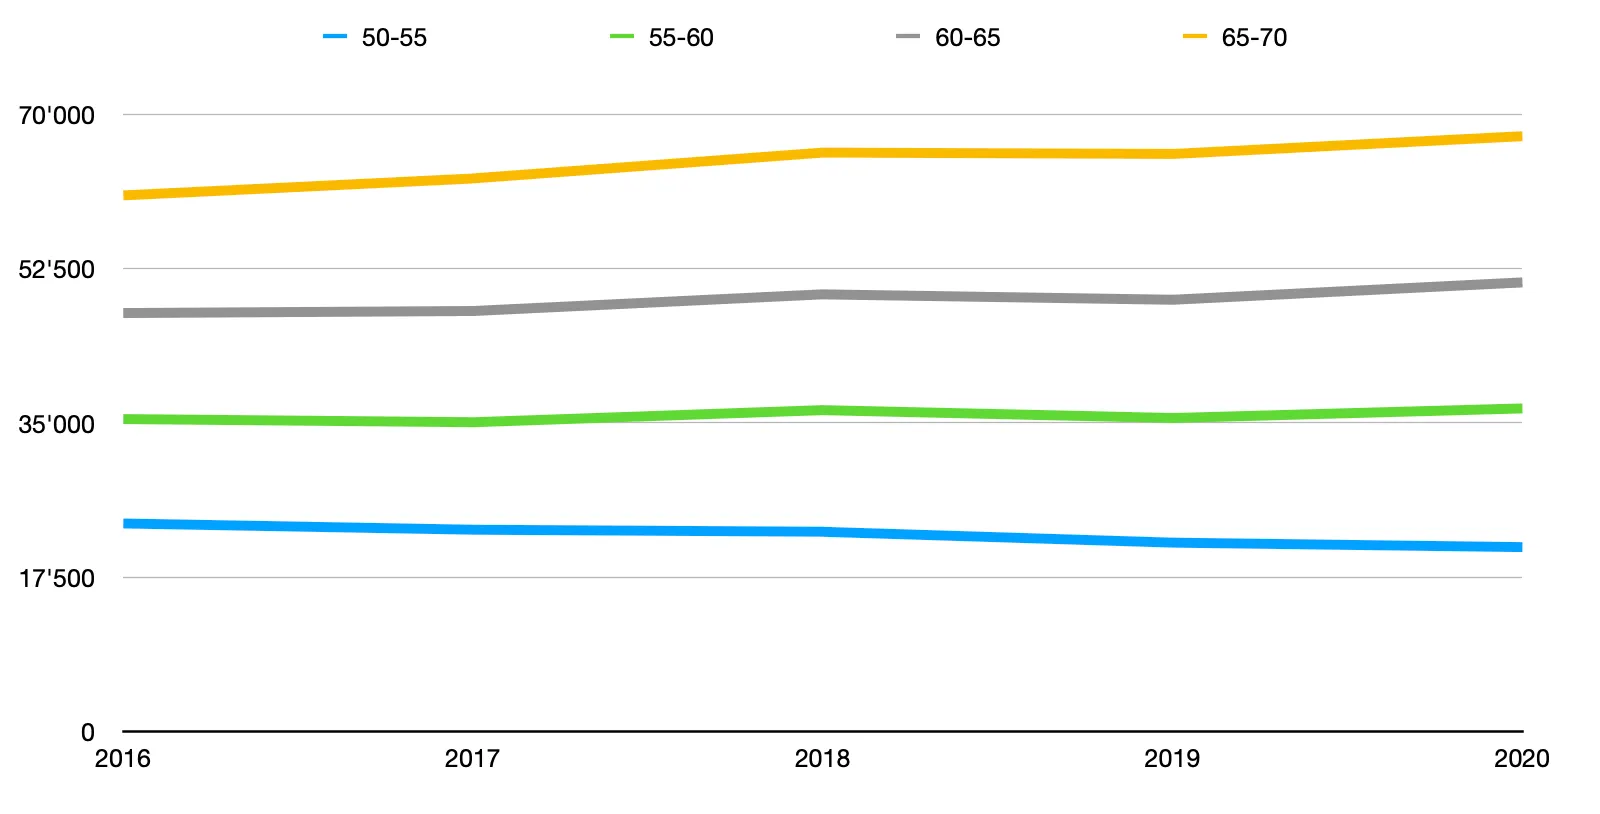
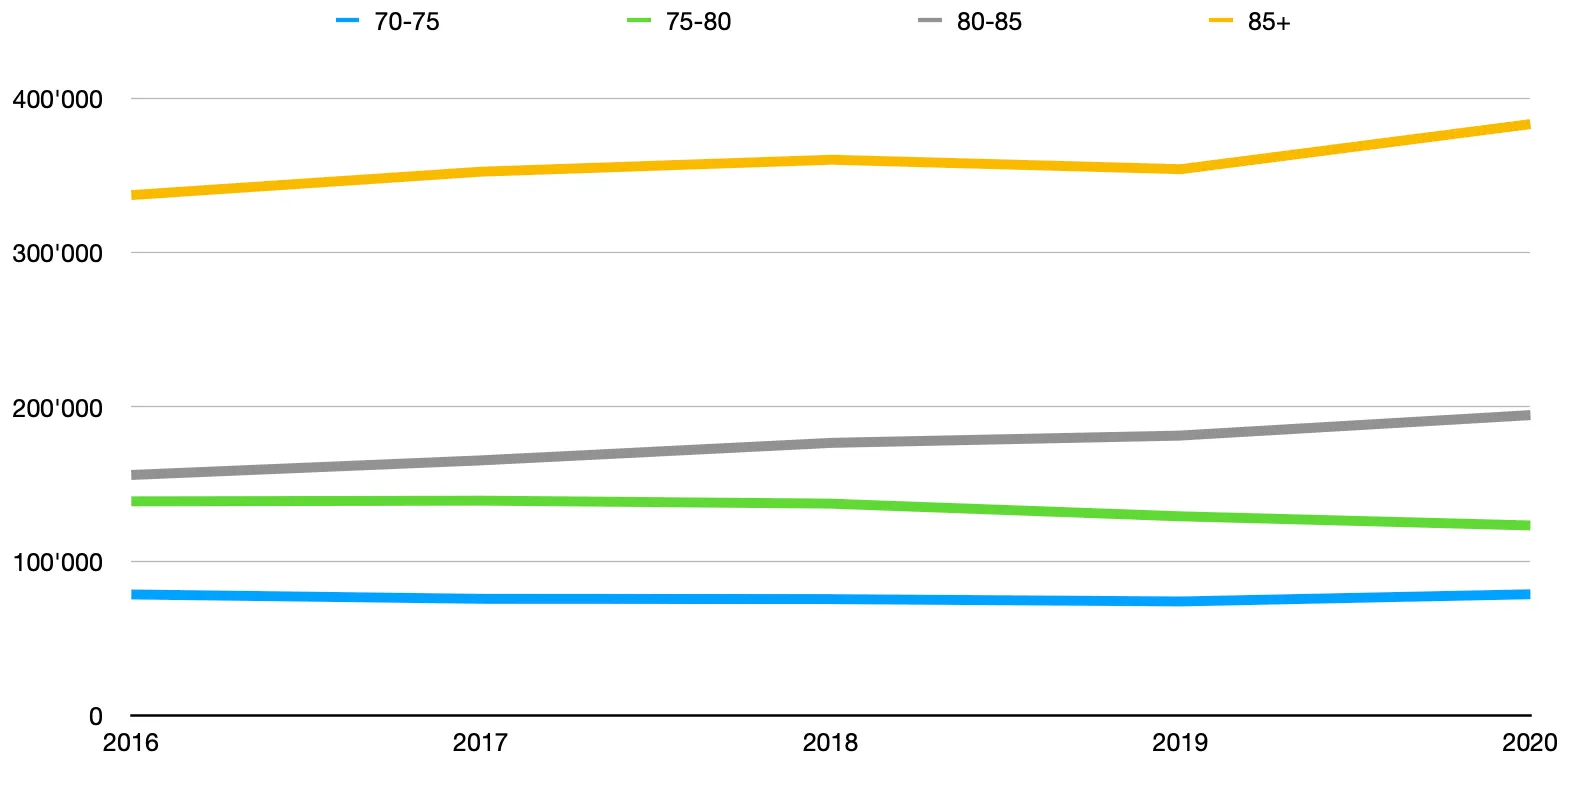
Visual inspection reveals counterintuitive patterns; deaths in the 45-55 cohort decline consistently across all five years, while the 85+ cohort exhibits monotonic increases. These patterns reflect demographic structure rather than mortality risk changes.
Population Demographics
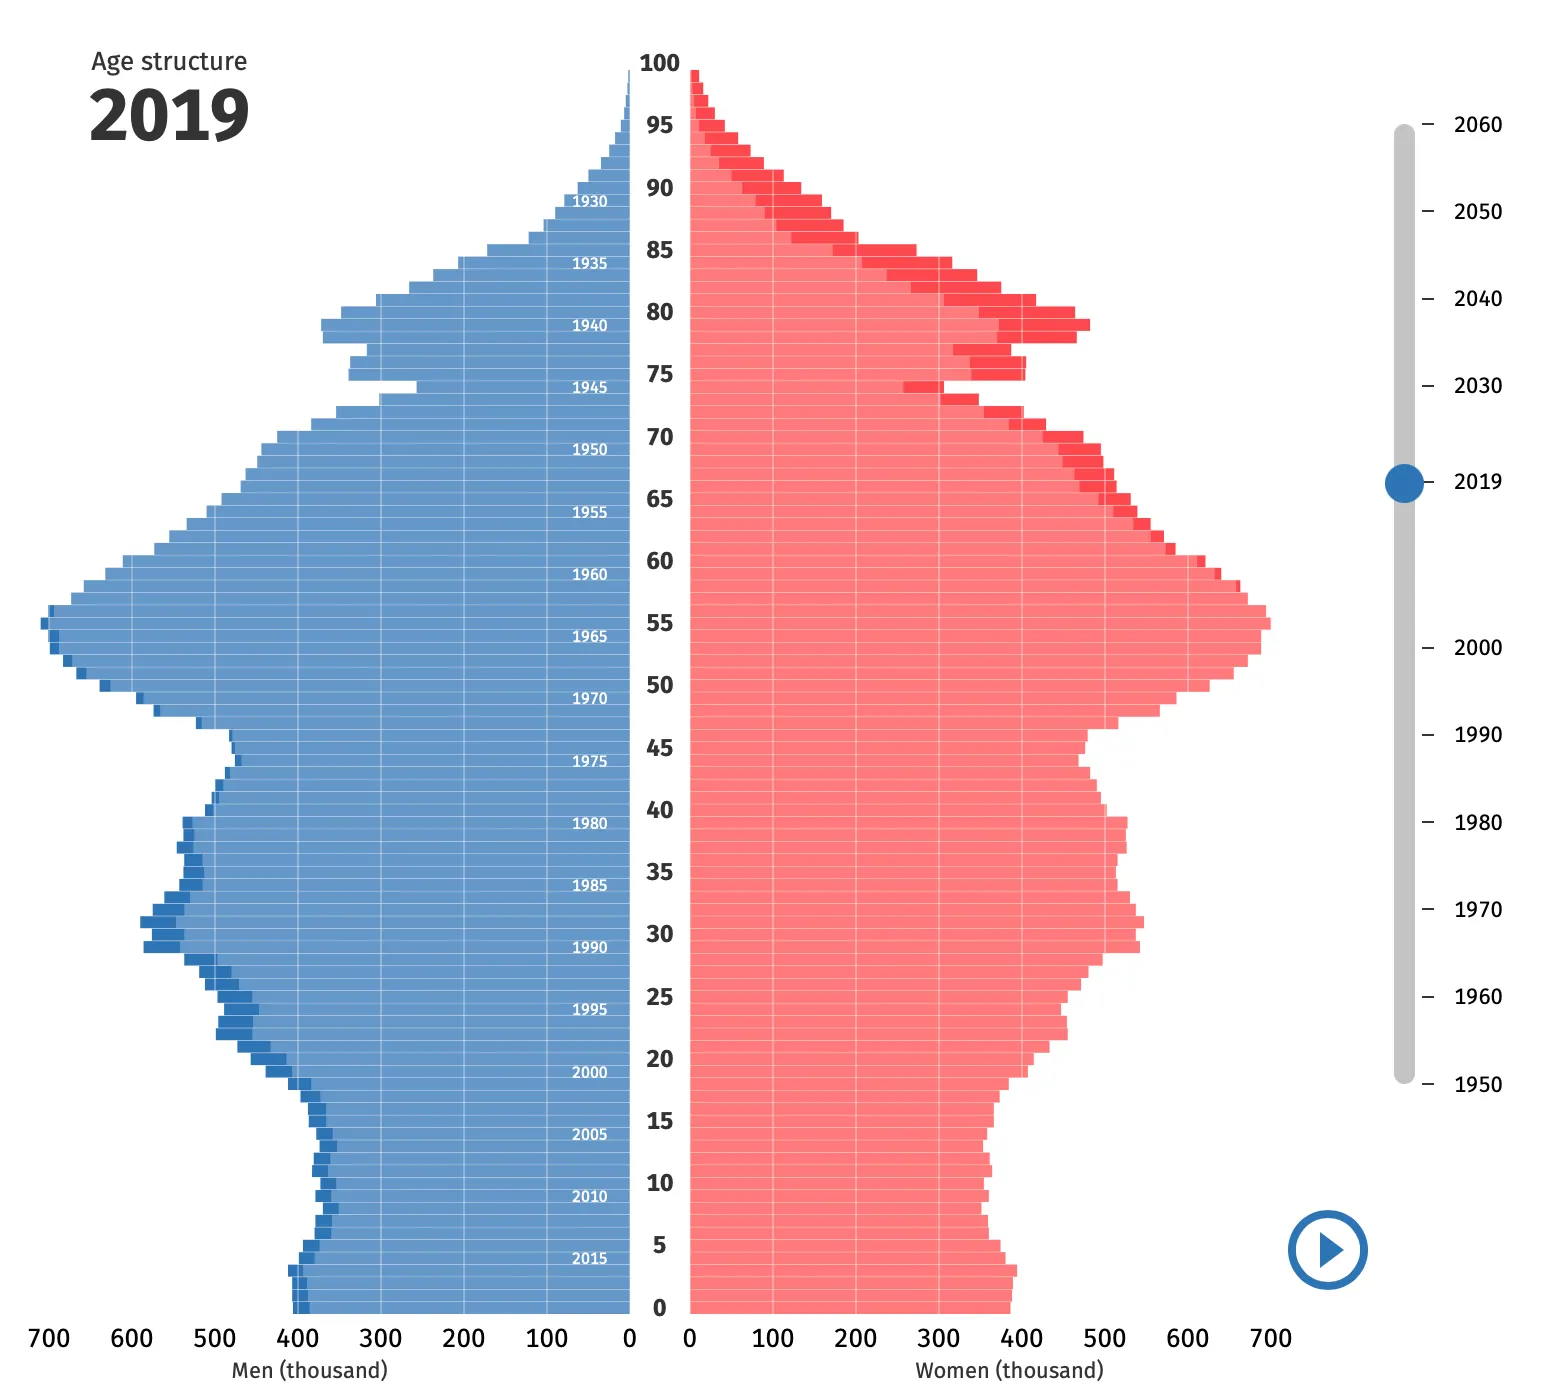
Germany’s population structure exhibits pronounced nonstationarity. The 2019 population pyramid4 demonstrates the characteristic deviations from equilibrium distribution; postwar birth cohorts, subsequent fertility declines, and migration patterns produce irregular age distributions that confound naïve mortality comparisons.
Fortunately, statistics about population ages are available with good resolution. This allows creation of tables for the same age groups used in death statistics:
| Age group | 31.12.2015 | 31.12.2016 | 31.12.2017 | 31.12.2018 | 31.12.2019 |
|---|---|---|---|---|---|
| 0-15 | 11'683'341 | 11'823'429 | 11'931'997 | 12'043'166 | 12'148'082 |
| 15-30 | 14'391'591 | 14'406'998 | 14'315'656 | 14'179'322 | 13'974'549 |
| 30-35 | 5'185'542 | 5'198'335 | 5'255'740 | 5'326'624 | 5'434'579 |
| 35-40 | 3'905'779 | 4'012'575 | 4'102'989 | 4'192'232 | 4'241'124 |
| 40-45 | 4'990'088 | 4'821'986 | 4'788'357 | 4'841'738 | 4'909'026 |
| 45-50 | 6'523'704 | 6'259'912 | 5'943'287 | 5'584'519 | 5'273'358 |
| 50-55 | 6'954'765 | 6'984'307 | 6'968'045 | 6'875'948 | 6'710'235 |
| 55-60 | 6'038'640 | 6'223'126 | 6'401'516 | 6'598'218 | 6'737'305 |
| 60-65 | 5'202'056 | 5'281'280 | 5'375'053 | 5'493'914 | 5'647'771 |
| 65-70 | 4'331'884 | 4'563'301 | 4'711'694 | 4'808'497 | 4'859'032 |
| 70-75 | 3'969'193 | 3'654'937 | 3'611'909 | 3'596'545 | 3'674'095 |
| 75-80 | 4'269'898 | 4'349'557 | 4'235'423 | 4'089'384 | 3'876'420 |
| 80-85 | 2'524'412 | 2'694'971 | 2'885'212 | 3'111'597 | 3'294'281 |
| 85+ | 2'204'791 | 2'246'939 | 2'265'473 | 2'277'509 | 2'386'854 |
| Total | 82'175'684 | 82'521'653 | 82'792'351 | 83'019'213 | 83'166'711 |
Source: 12411-0005 Bevölkerung: Deutschland, Stichtag, Altersjahre, GENESIS-Online database.
Visual analysis of these demographic shifts demonstrates the magnitude of cohort size changes across the observation period:
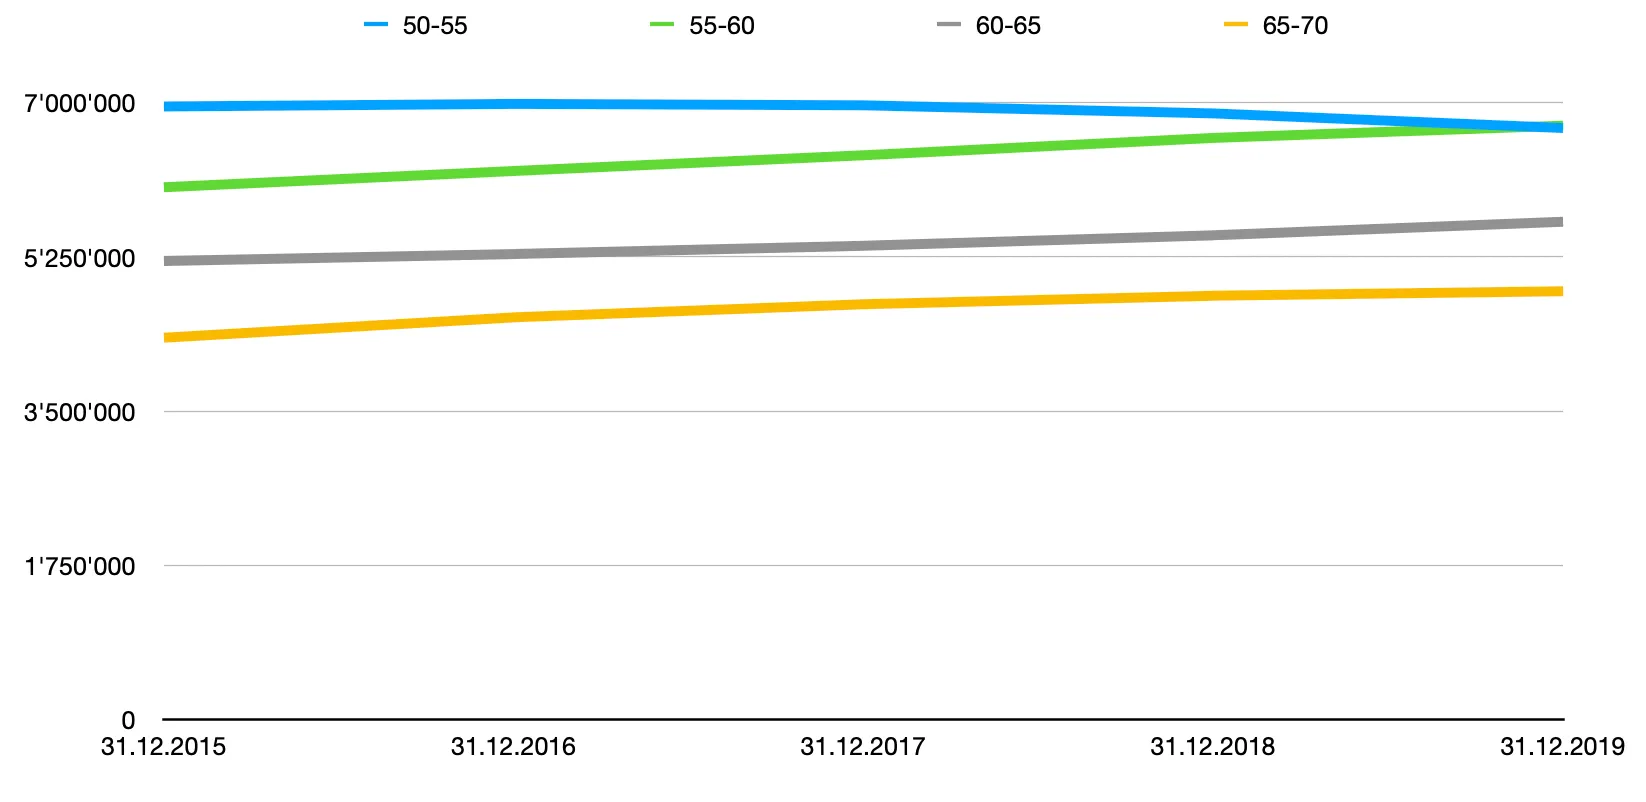
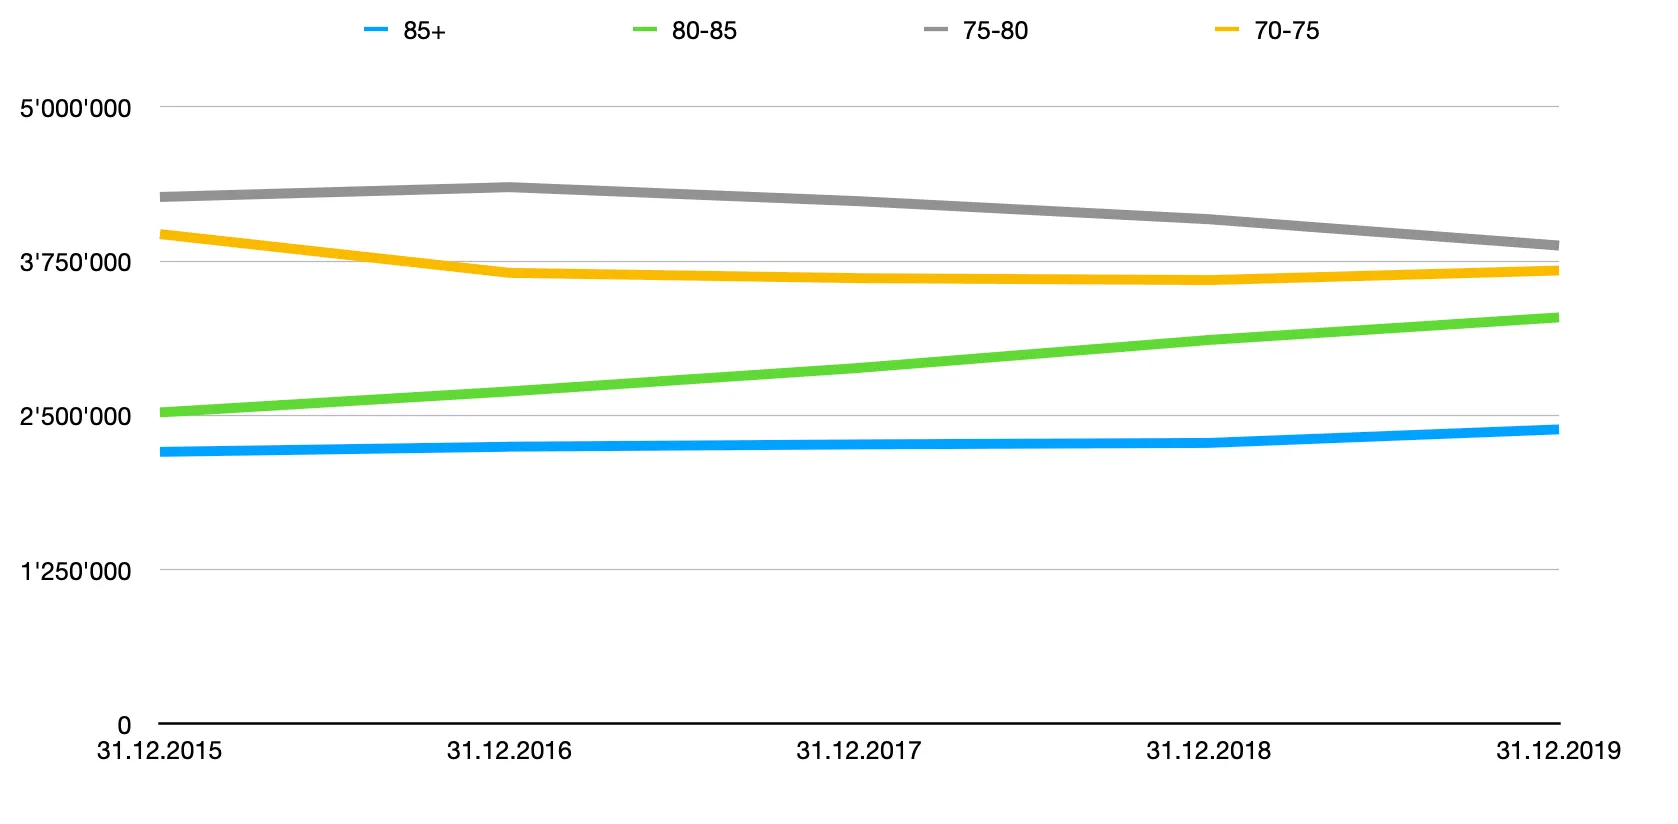
The 0-15 and 30-40 cohorts remain approximately constant, likely sustained by migration and birth patterns. The 15-30 and 40-55 cohorts contract as smaller birth cohorts age into them. The 80+ cohorts expand substantially as larger historical birth cohorts enter advanced age. These shifts directly impact expected mortality; larger elderly cohorts necessarily produce more deaths absent any change in age specific risk.
Age Adjusted Mortality Analysis
Proper analysis requires normalization; for each age cohort, the mortality rate is computed as deaths in year N divided by population at December 31 of year N-1. This yields the proportion of each cohort dying within the subsequent year, isolating mortality risk from demographic composition effects.
| Age group | 2016 | 2017 | 2018 | 2019 | 2020 |
|---|---|---|---|---|---|
| 0-15 | 0.03250% | 0.03022% | 0.03028% | 0.02953% | 0.02816% |
| 15-30 | 0.03038% | 0.02884% | 0.02935% | 0.02799% | 0.02766% |
| 30-35 | 0.05188% | 0.05219% | 0.05017% | 0.04947% | 0.04930% |
| 35-40 | 0.09517% | 0.09351% | 0.09342% | 0.09301% | 0.09776% |
| 40-45 | 0.11727% | 0.11020% | 0.11584% | 0.11225% | 0.12013% |
| 45-50 | 0.19608% | 0.18773% | 0.18609% | 0.18157% | 0.18554% |
| 50-55 | 0.33922% | 0.32762% | 0.32511% | 0.31145% | 0.31158% |
| 55-60 | 0.58677% | 0.56359% | 0.56943% | 0.53881% | 0.54393% |
| 60-65 | 0.91229% | 0.90302% | 0.92248% | 0.89128% | 0.90197% |
| 65-70 | 1.40362% | 1.37466% | 1.39355% | 1.36226% | 1.38970% |
| 70-75 | 1.97688% | 2.06811% | 2.08856% | 2.05447% | 2.13911% |
| 75-80 | 3.24989% | 3.20106% | 3.24171% | 3.15610% | 3.17641% |
| 80-85 | 6.17459% | 6.13521% | 6.12392% | 5.83106% | 5.90957% |
| 85+ | 15.29796% | 15.68650% | 15.89986% | 15.54571% | 16.05959% |
| Total | 1.10848% | 1.12972% | 1.15334% | 1.13169% | 1.18501% |
Visualization of these normalized mortality rates clarifies the age specific patterns that absolute death counts obscure:
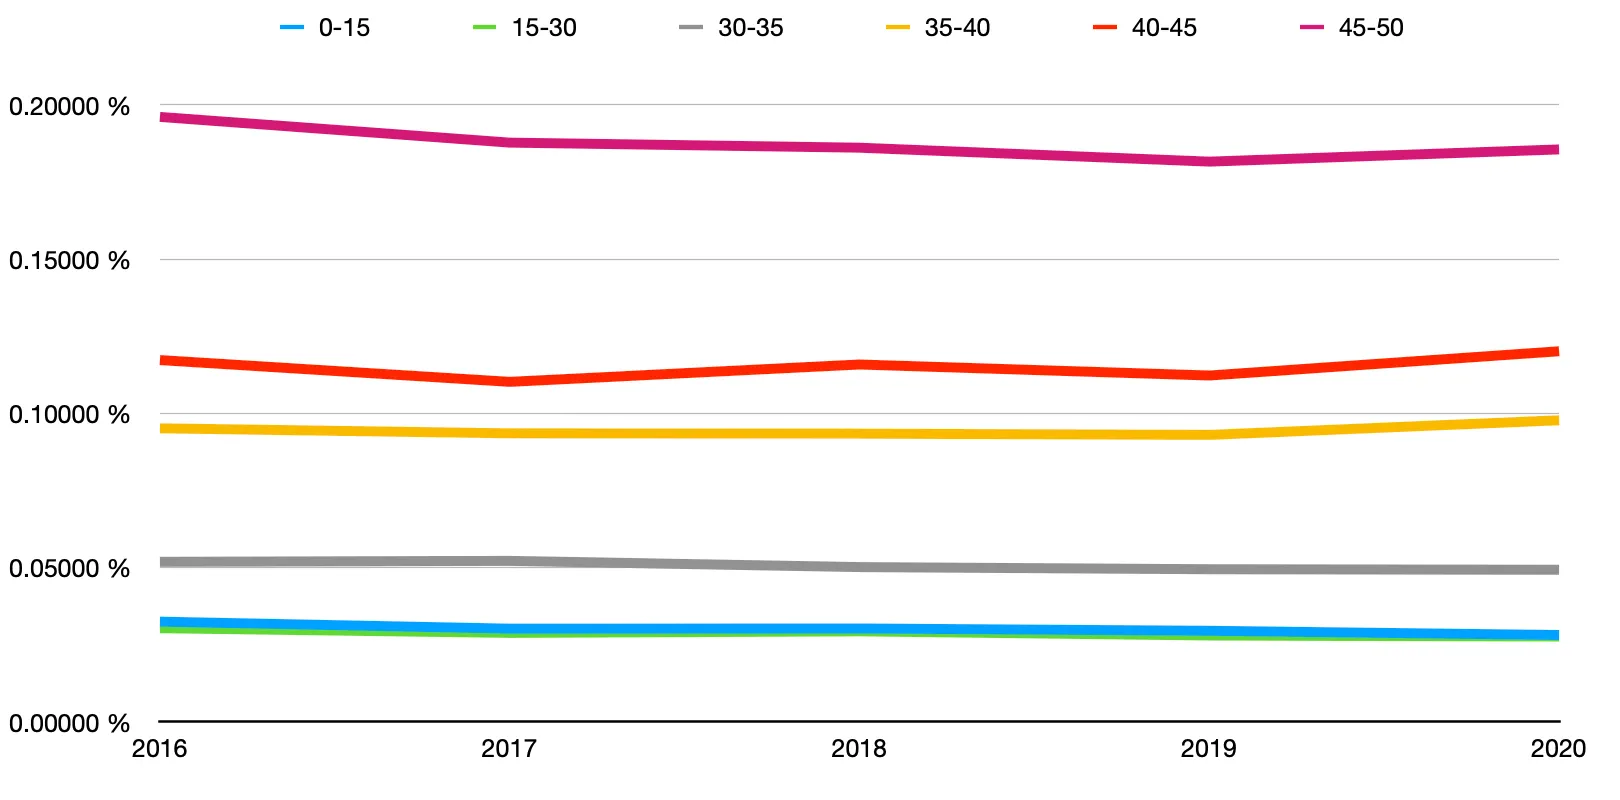
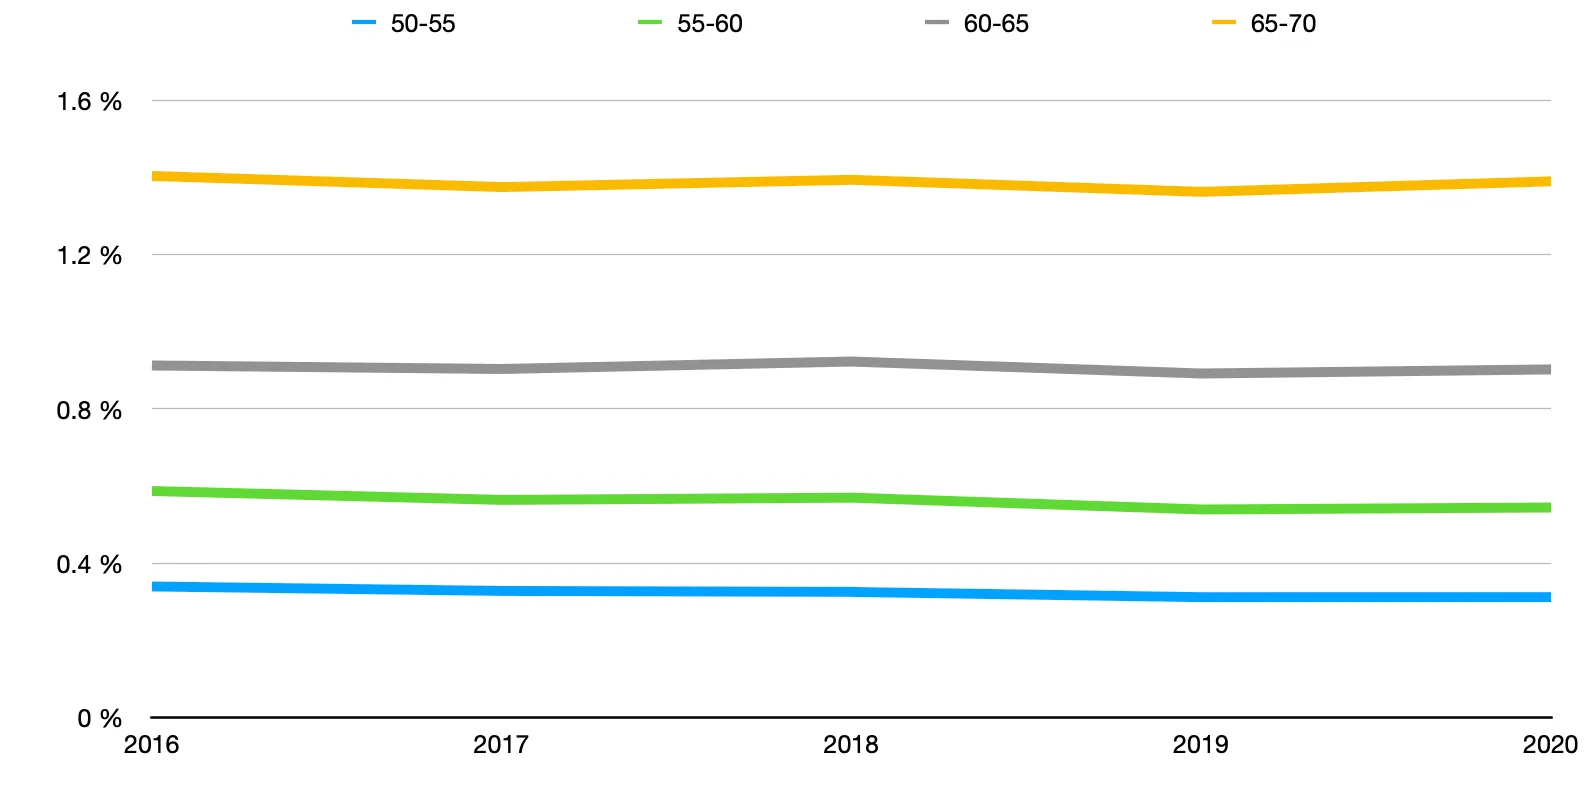
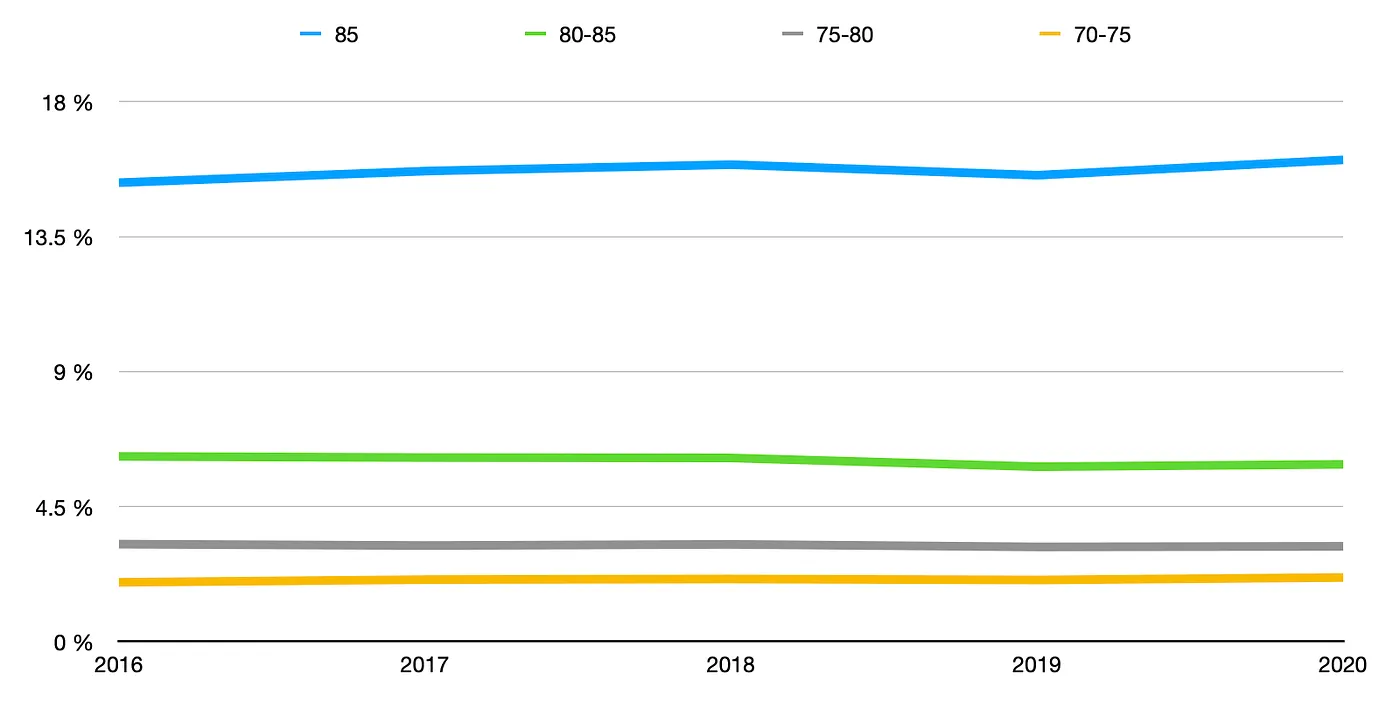
These normalized rates reveal patterns obscured by absolute counts. Comparing 2020 to the 2016-2019 baseline:
- Age 0-50: Mortality rates decreased or remained stable across all cohorts;
- Age 35-45: Slight increase of approximately 0.0025 percentage points;
- Age 70-75: Increase of approximately 0.05 percentage points;
- Age 85+: Increase of approximately 0.15 percentage points;
- All other cohorts: Decreased mortality rates.
Sources of Measurement Error
This analysis incorporates several known sources of bias. Age group boundary effects occur when individuals die shortly after aging into the next cohort, creating systematic classification errors. Migration patterns, particularly among working age populations, affect denominator calculations without corresponding mortality adjustments. Medical tourism may introduce geographic attribution errors for a small fraction of deaths. These measurement artifacts introduce noise but likely do not systematically bias the directional conclusions regarding temporal mortality trends within cohorts.
Despite these limitations, the analysis permits several conclusions. The 85+ cohort exhibits an increase of approximately 0.15 percentage points in annual mortality rate. This cohort experienced World War II, subsequent Soviet occupation for ethnic Germans, and mass migration after 1991; historical trauma effects on late life mortality remain plausible confounds that cannot be fully disentangled from pandemic effects with available data granularity.
Afterword
The analysis demonstrates that COVID-19 mortality impact in Germany, when properly adjusted for demographic composition, proves substantially smaller than aggregate death count comparisons suggest. An increase of 0.15 percentage points in the 85+ cohort, representing the primary signal, must be interpreted against baseline annual variation and the complex life histories of this specific birth cohort.
Government intervention effectiveness cannot be assessed with annual aggregate data; evaluation would require weekly or monthly age stratified population denominators, which remain unavailable from official sources. Extension of this analysis methodology to earlier baseline years would strengthen conclusions but remains constrained by data availability, as age stratified mortality data exist only from 2016 forward.
This analysis exemplifies Simpson’s Paradox;5 conclusions from aggregate data reverse when properly stratified by the lurking variable, population age structure in this case. The apparent large increase in total deaths primarily reflects demographic aging rather than elevated age specific mortality risk across most cohorts.
This analysis was completed in April 2021 using mortality and population data available at that time; Statistisches Bundesamt has since revised certain figures and published additional years of data, but these revisions remain minor and do not materially affect the conclusions drawn here. The analysis deliberately restricts itself to the 2016-2020 baseline period to evaluate the official evaluation’s claims about 2020 mortality patterns, ensuring that any critique addresses the methodology and interpretation applied to comparable historical data rather than engaging with incomplete year statistics. The core methodological argument, that age stratified mortality rates normalized for demographic composition reveal substantially different patterns than aggregate death counts, remains valid independent of subsequent minor statistical adjustments.
Statistisches Bundesamt (Federal Statistical Office of Germany) ↩︎
Ad-hoc evaluation of mortality figures for 2020/2021, Statistisches Bundesamt, August 2021. ↩︎
The official evaluation characterizes 2020 mortality as reflecting weak influenza activity in early months, COVID-19 impact beginning late March with April deaths 10% above the 2016-2019 average, summer heat wave effects in August, and substantial divergence from October forward culminating in December figures 32% above the four year average concurrent with laboratory confirmed COVID-19 deaths. For 2021, death figures exceeded the 2017-2020 average by 21% in January, fell below average in February and March (-3% and -10% respectively) during an absent influenza season, rose above average in April and May (+4% and +6%), spiked 16% during a June heat wave, and exhibited variable patterns through July; the report attributes below average February and March figures to the virtual absence of typical flu wave mortality that historically peaks during these months, suggesting that pandemic containment measures may have reduced deaths from other respiratory infectious diseases while simultaneously preventing some COVID-19 deaths. ↩︎
14. koordinierte Bevölkerungsvorausberechnung für Deutschland, Statistisches Bundesamt interactive population pyramid. ↩︎
For detailed exposition of Simpson’s Paradox, see the Wikipedia article. A practical example of this paradox in economic analysis can be found in this discussion of tax burden calculations. ↩︎